Optical coherence tomography (OCT) can be used to detect and monitor fluid exudation and morphologic changes associated with vascular diseases in the posterior segment. However, structural OCT cannot directly detect capillary dropout or neovascularization, the major vascular changes associated with the leading causes of blindness—age-related macular degeneration (AMD) and diabetic retinopathy (DR).
AT A GLANCE
• FA and ICGA do not offer precise views of neovascularization.
• OCTA is a quick, safe, easy, and inexpensive method of diagnosing and monitoring retinal diseases.
• Better identification of nonperfused zones, capillary dropout areas, vascular dilatations and abnormalities, and neovascularization are possible with OCTA compared with classic retinal angiography.
The traditional imaging methods used in the study of normal and pathologic retinal vessels, fluorescein angiography (FA) and indocyanine green angiography (ICGA), also do not allow a precise view of neovascularization. They provide blurred images of the vascular network based on dye leakage. These imaging procedures hold a fundamental place in retinal imaging; however, their invasive nature sometimes causes patients to experience mild to serious side effects.
OCT angiography (OCTA) is a fast, easy, safe, and inexpensive option for diagnosing and monitoring a variety of retinal disorders. This article examines the use of OCTA, specifically with the AngioVue OCTA system (Optovue) in the visualization of the retinal and choroidal vasculature.
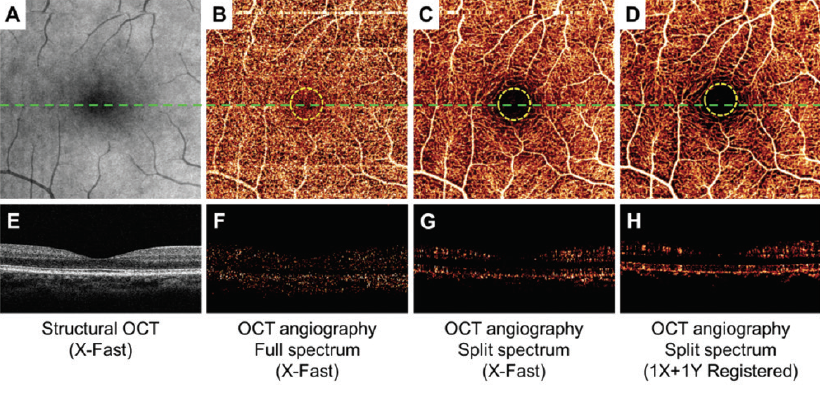
Figure 1. En face maximum decorrelation projections of retinal circulation show less noise inside the FAZ (within yellow dotted circles) and more continuous perifoveal vascular networks using the SSADA algorithm (C and D) compared with standard full-spectrum algorithm (B). The cross-sectional angiograms (scanned across the green dashed line in B, C, and D) show more clearly delineated retinal vessels and less noise using the SSADA algorithm (G and H) than the standard full-spectrum algorithm (F).
TECHNOLOGY OVERVIEW
WATCH IT NOW
Video 1. Features of PDR
This video highlights features of PDR by segmenting the macula layer by layer.
David Huang, MD, PhD, created the split-spectrum amplitude-decorrelation angiography (SSADA) algorithm,1 which detects motion in blood vessels by measuring variations in the reflected OCT signal amplitude between consecutive cross-sectional scans and then processes it to enhance flow detection and reject axial bulk motion noise. The SSADA algorithm splits the OCT image into different spectral bands, thereby increasing the number of usable image frames and shortening the scan acquisition process. Compared with full-spectrum methods, SSADA improves the signal-to-noise (SNR) ratio to provide clean and continuous imaging of the microvascular network with less noise inside the foveal avascular zone (FAZ) (Figure 1).
The AngioVue OCTA system uses the SSADA algorithm and incorporates other technological innovations, including DualTrac Motion Correction, which provides two levels of motion correction. The first level, real-time tracking, removes large artifacts such as those that occur when a patient blinks. The second level, performed in the image postprocessing phase, is a pixel-level correction for small eye motions such as saccades. With this combination, SNR and overall image quality are improved, particularly in distinct small retinal vessels. Image quality is further improved by proprietary software that detects projection artifacts and automatically removes ghost images of superficial capillary plexus vessels projected onto deeper retinal layers.
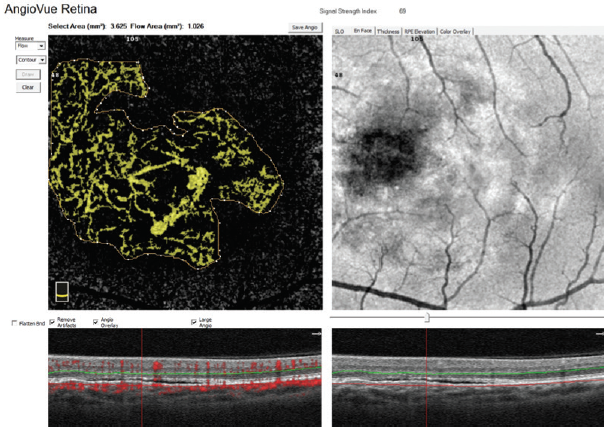
Figure 2. CNV flow area quantification with AngioAnalytics.
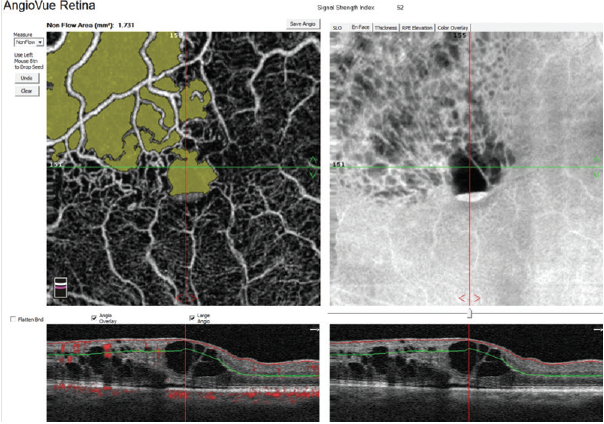
Figure 3. Nonflow area quantification in a patient with central retinal vein occlusion (CRVO).
Quantitative Analysis
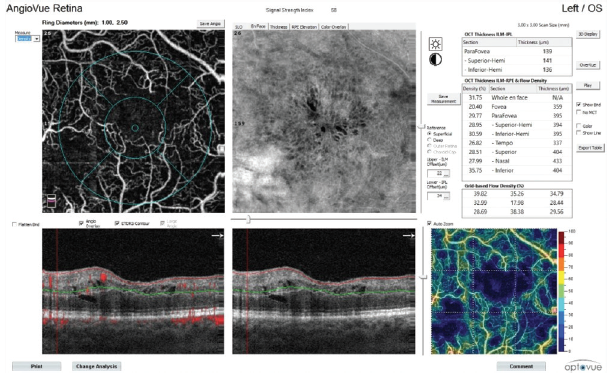
Figure 4. Vessel density analysis in a patient with CRVO.
A helpful step for everyday clinical applications of OCTA has been the development of AngioAnalytics (Optovue), software that provides numerical data about flow area, nonflow area, and vessel density. The flow area measurement tool is useful in the follow-up of choroidal neovascularization (CNV). The operator simply draws the CNV boundary, and the software then calculates the size of the drawn area and vessel area in square millimeters (Figure 2). The nonflow area tool allows clinicians to highlight and monitor the FAZ as well as nonperfused areas in ischemic retinopathies such as DR and retinal vein occlusions (Figure 3). Finally, the vessel density tool automatically calculates the percentage of flow versus nonflow area in an ETDRS grid centered on the macula and in a color-coded vessel density map divided into nine sectors (Figure 4).
IMAGING RETINAL DISORDERS
OCTA produces 3-D images of the retinal and choroidal microvasculature, allowing the user to view each layer separately to determine quickly and precisely from which layer pathology originates. Below is a rundown of some of the disease states in which OCTA can be a helpful tool.
Diabetic Retinopathy
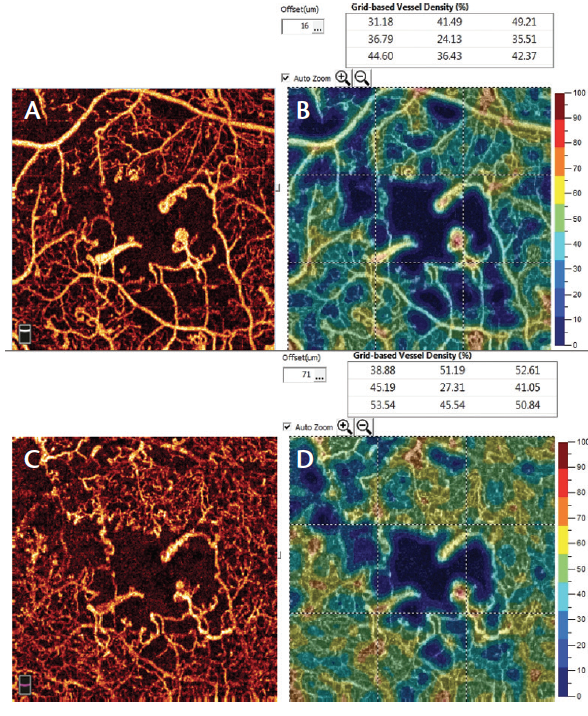
Figure 5. AngioVue imaging (superficial [A] and deep plexus [C] with vessel density quantification [B and D]) of proliferative DR shows areas of nonperfusion, microaneurysms, and clear enlargement of FAZ.
In patients with DR, OCTA demonstrates retinal alterations including capillary dropout in the superficial and deep plexuses, FAZ enlargement, and microaneurysms (Figure 5). The ability to separately examine the superficial and deep capillary plexuses with OCTA helps users to delineate retinal involvement in various diabetic lesions (Video 1). For instance, widening of the FAZ is best seen in the superficial plexus, whereas capillary dropout and microaneurysms are best appreciated in the deep plexus. However, microaneurysms are visible on OCTA only in the presence of intravascular flow; therefore, those with slow flow or thrombosis will remain undetected. The detection of preretinal and prepapillary neovascularization is also facilitated with OCTA, as these new vessels are not blurred by leakage in dye-based angiography.
Retinal Vein Occlusion
OCTA highlights four important features of branch retinal vein occlusion (BRVO): FAZ enlargement, capillary dropout, microvascular abnormalities, and vascular congestion. Through our clinical experience with superficial and deep networks we have found that, unlike FA, OCTA allows in-depth study of vascular changes in vein occlusions. Changes in the structure of the superficial network can be observed in patients with macular ischemia. Occlusions are evident in the study of the superficial plexus and slightly less evident in the deep network. However, the demarcation of nonflow areas is more obvious in the superficial plexus. Additionally, arteriovenous anastomoses and vascular loops are easily observed.
Case Example
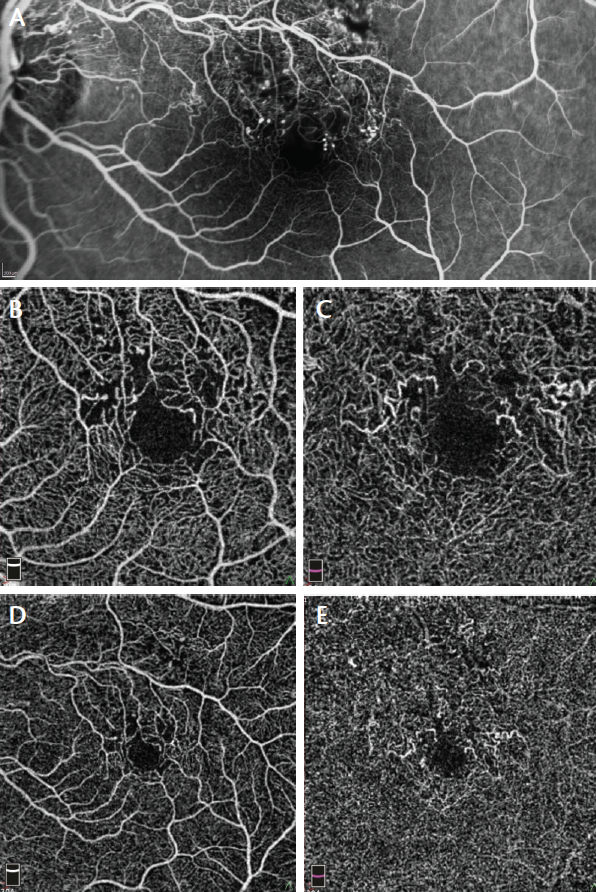
Figure 6. FA (A) and 3 mm x 3 mm (B) and 6 mm x 6 mm (D) superficial plexus OCTA of a 47-year-old man with ischemic BRVO show rarefaction of capillary texture, microaneurysms, and capillary dropout. By contrast, 3 mm x 3 mm (C) and 6 mm x 6 mm (E) deep plexus OCTA show capillary dilation and vessel congestion, probably due to high hydrostatic pressure. These features are not visible on FA.
We performed FA (Figure 6A) and OCTA of the superficial plexus (Figure 6B and 6D) in a 47-year-old man with ischemic BRVO. Both imaging modalities showed rarefaction of capillary texture, microaneurysms, and capillary dropout. OCTA of the deep plexus (Figure 6C and 6E) showed capillary dilation and vessel congestion, likely due to high hydrostatic pressure. These features were not visible on FA.
Age-Related Macular Degeneration
In type 1 CNV secondary to AMD (Figure 7), the new vessels initially appear under the pigment epithelium, and no flow is seen in the avascular outer retina. The neovascular network is often extensive, with high flow and varied morphology (Video 2). New vessels may appear in a variety of shapes, including a medusa head, coral reef, bicycle wheel, fan, and dead tree. The tangled network generally contains filaments, loops, and a vascular arcade. The vascular complex almost always has a feeder trunk or a bundle of feeder vessels.
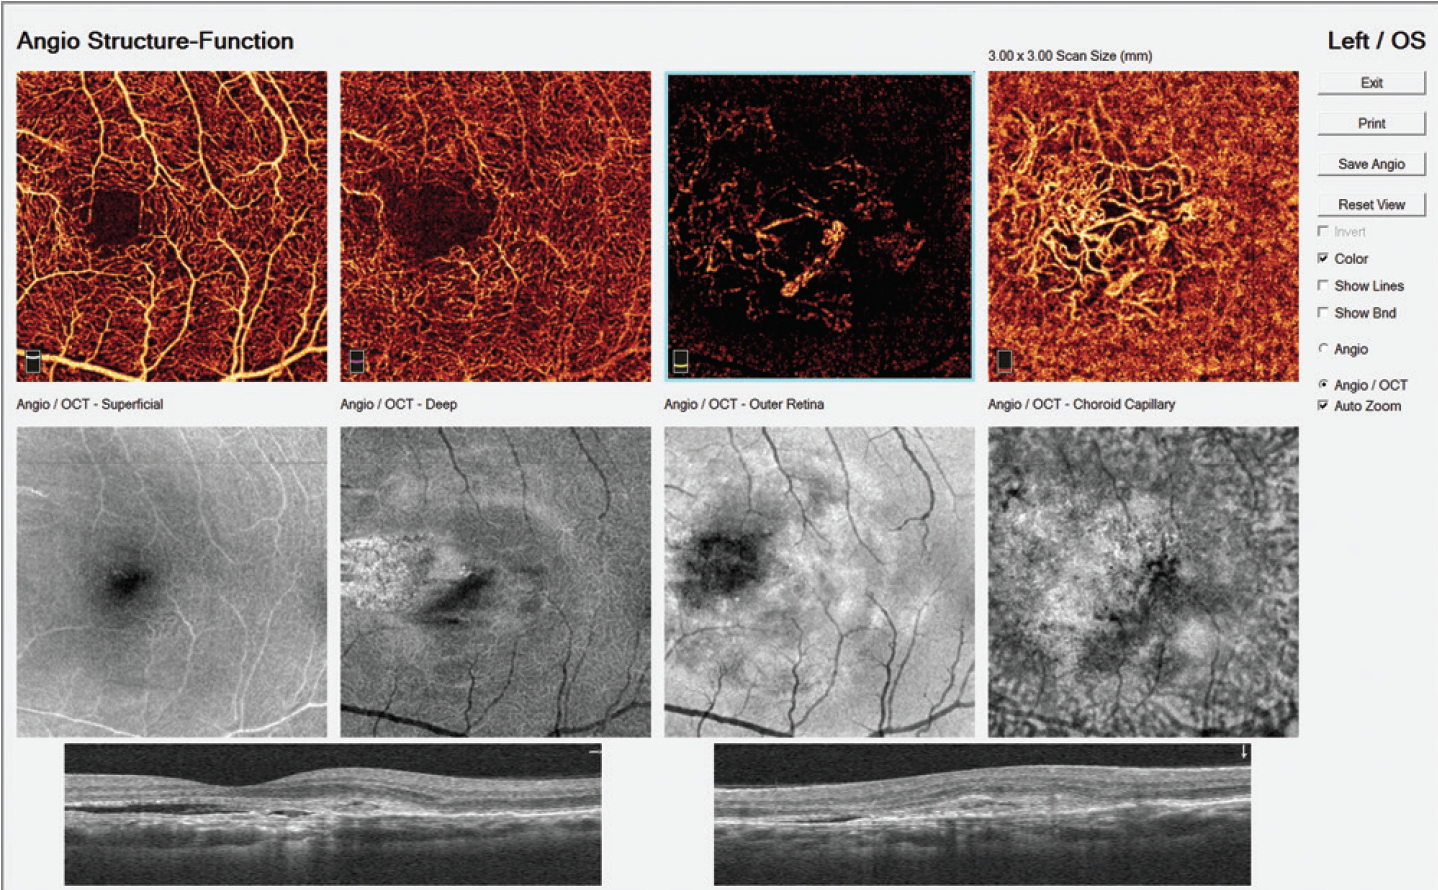
Figure 7. Typical AngioVue report in type 1 CNV. The cross-sectional OCT shows irregular subretinal fluid with thickened photoreceptor outer segments. Hyperreflective material is evident at the fluid site with irregular retinal pigment epithelium. OCTA shows normal texture of the vascular retina (superficial and deep capillary plexuses). A large, irregular neovascular network is evident in the choriocapillaris layer.
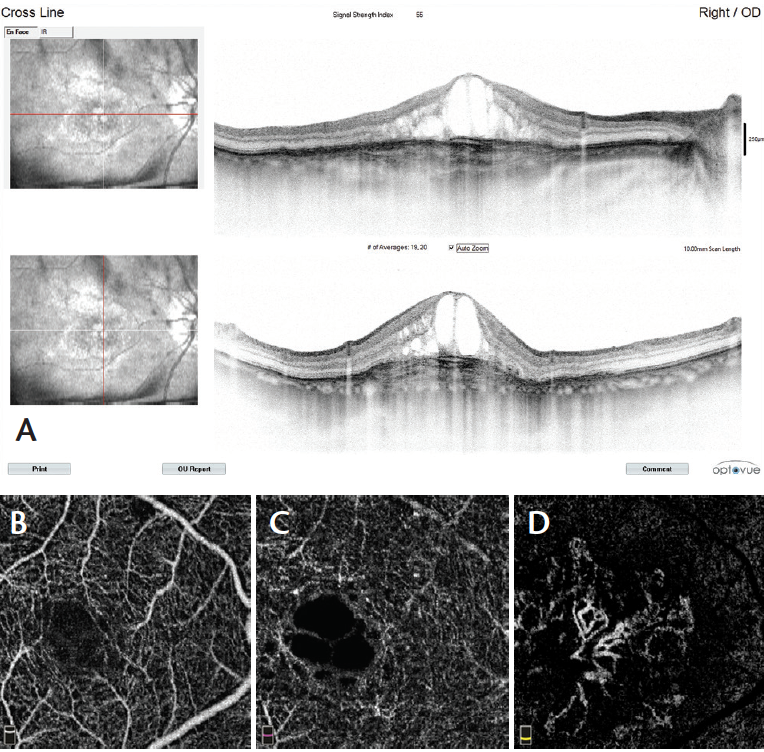
Figure 8. Cross-sectional OCT in type 2 CNV reveals CME, white intraretinal dots, and pseudostratified substance below the retina (A, right-hand images). OCTA scans show normal texture of the vascular retina in the superficial (B) and deep (C) capillary plexuses. The avascular zone (D)reveals a large neovascular wheel-shaped network with a central main mature vessel surrounded by growing loops.
In type 2 CNV (Figure 8) new vessels are always located above the retinal pigment epithelium, but they also spread deeply into the outer retinal avascular area. The flow is high; however, the morphology is less varied than in type 1 CNV, with the morphology most frequently appearing as bicycle wheel or fan-like shapes (Video 3). The neovascular network area is smaller than in type 1 CNV.
CONCLUSION
Patient examination with the AngioVue OCTA system is easier and faster than with FA or ICGA. Image acquisition takes less than 6 seconds, and image processing adds only a few additional seconds. Furthermore, the AngioAnalytics software enables improved clinical assessment of vascular retinal diseases by providing reliable and reproducible quantitative analysis.
WATCH IT NOW
Video 2. Where’s the CNV?
Segmentation of the macula layer by layer allows the surgeon to identify
new vessels in the avascular zone.

Video 3. A Better Appreciation of CNV
In this video, cystic black spaces seen in the deep capillary complex represent cystoid macular edema (CME) secondary to the exudative process. Both type 1 and type 2 CNV can also be seen.

OCTA is an important improvement over classic dye-based angiography, as it enables better identification of nonperfused zones, capillary dropout areas, vascular dilatations and abnormalities, and neovascularization. It is possible that OCTA will soon hold a more prominent role in the scientific and clinical examination of vascular retinal diseases, replacing the use of FA and ICGA in many clinical conditions. n
OPTIONS IN OCTA
By the staff of Retina Today
1. Study shows new technology may improve management of leading causes of blindness [press release]. Portland, OR: Oregon Health & Sciences University; April 20, 2015.
Luca Di Antonio, MD, PhD
• retina consultant for the Ophthalmology Department Center
of Excellence, National Hightech Center and Italian School of
Robotic Surgery in Ophthalmology University “G d’Annunzio”
of Chieti-Pescara, Italy
• financial interest: none acknowledged
• monsieurluca@yahoo.com
Bruno Lumbroso, MD
• director, Centro Oftalmologico Mediterraneo, Roma, Italy
• financial disclosure: consultant to Optovue
• bruno.lumbroso@gmail.com
Leonardo Mastropasqua, MD
• full professor of ophthalmology, head of the ophthalmology
department, and head of the Center of Excellence at National
High-tech Center and Italian School of Robotic Surgery in
Ophthalmology University “G d’Annunzio” of Chieti-Pescara,
Italy; president of the Italian Council of University Professors in
Ophthalmology; and president of the Italian Society of University Ophthalmologists
• financial interest: none acknowledged
• mastropa@unich.it
Marco Rispoli, MD
• retina consultant at Centro Oftalmologico Mediterraneo Clinic
and at Medical Retina Department of Nuovo Regina Margherita
Hospital, both in Rome, Italy
• financial disclosure: consultant to Optovue
• rispolimarco@gmail.com


_1784132761.jpg?auto=compress,format&w=75)